Ownership Map: Visualize Who Owns What Across Your Architecture
There's a question that sounds simple but trips up most engineering organizations: who owns this service?
Not who built it. Not who last committed to it. Who is responsible for it right now — for its uptime, its technical debt, its API contracts, its security posture. When something breaks at 2am, who gets paged? When a new team needs to integrate with it, who do they talk to?
In small companies, everyone knows. In growing ones, the answer gets fuzzy fast. Teams split, services multiply, people change roles. The org chart says one thing, the codebase says another, and the architecture diagram says nothing at all — because ownership was never part of the picture.
We built the Ownership Map to fix that.
What It Is
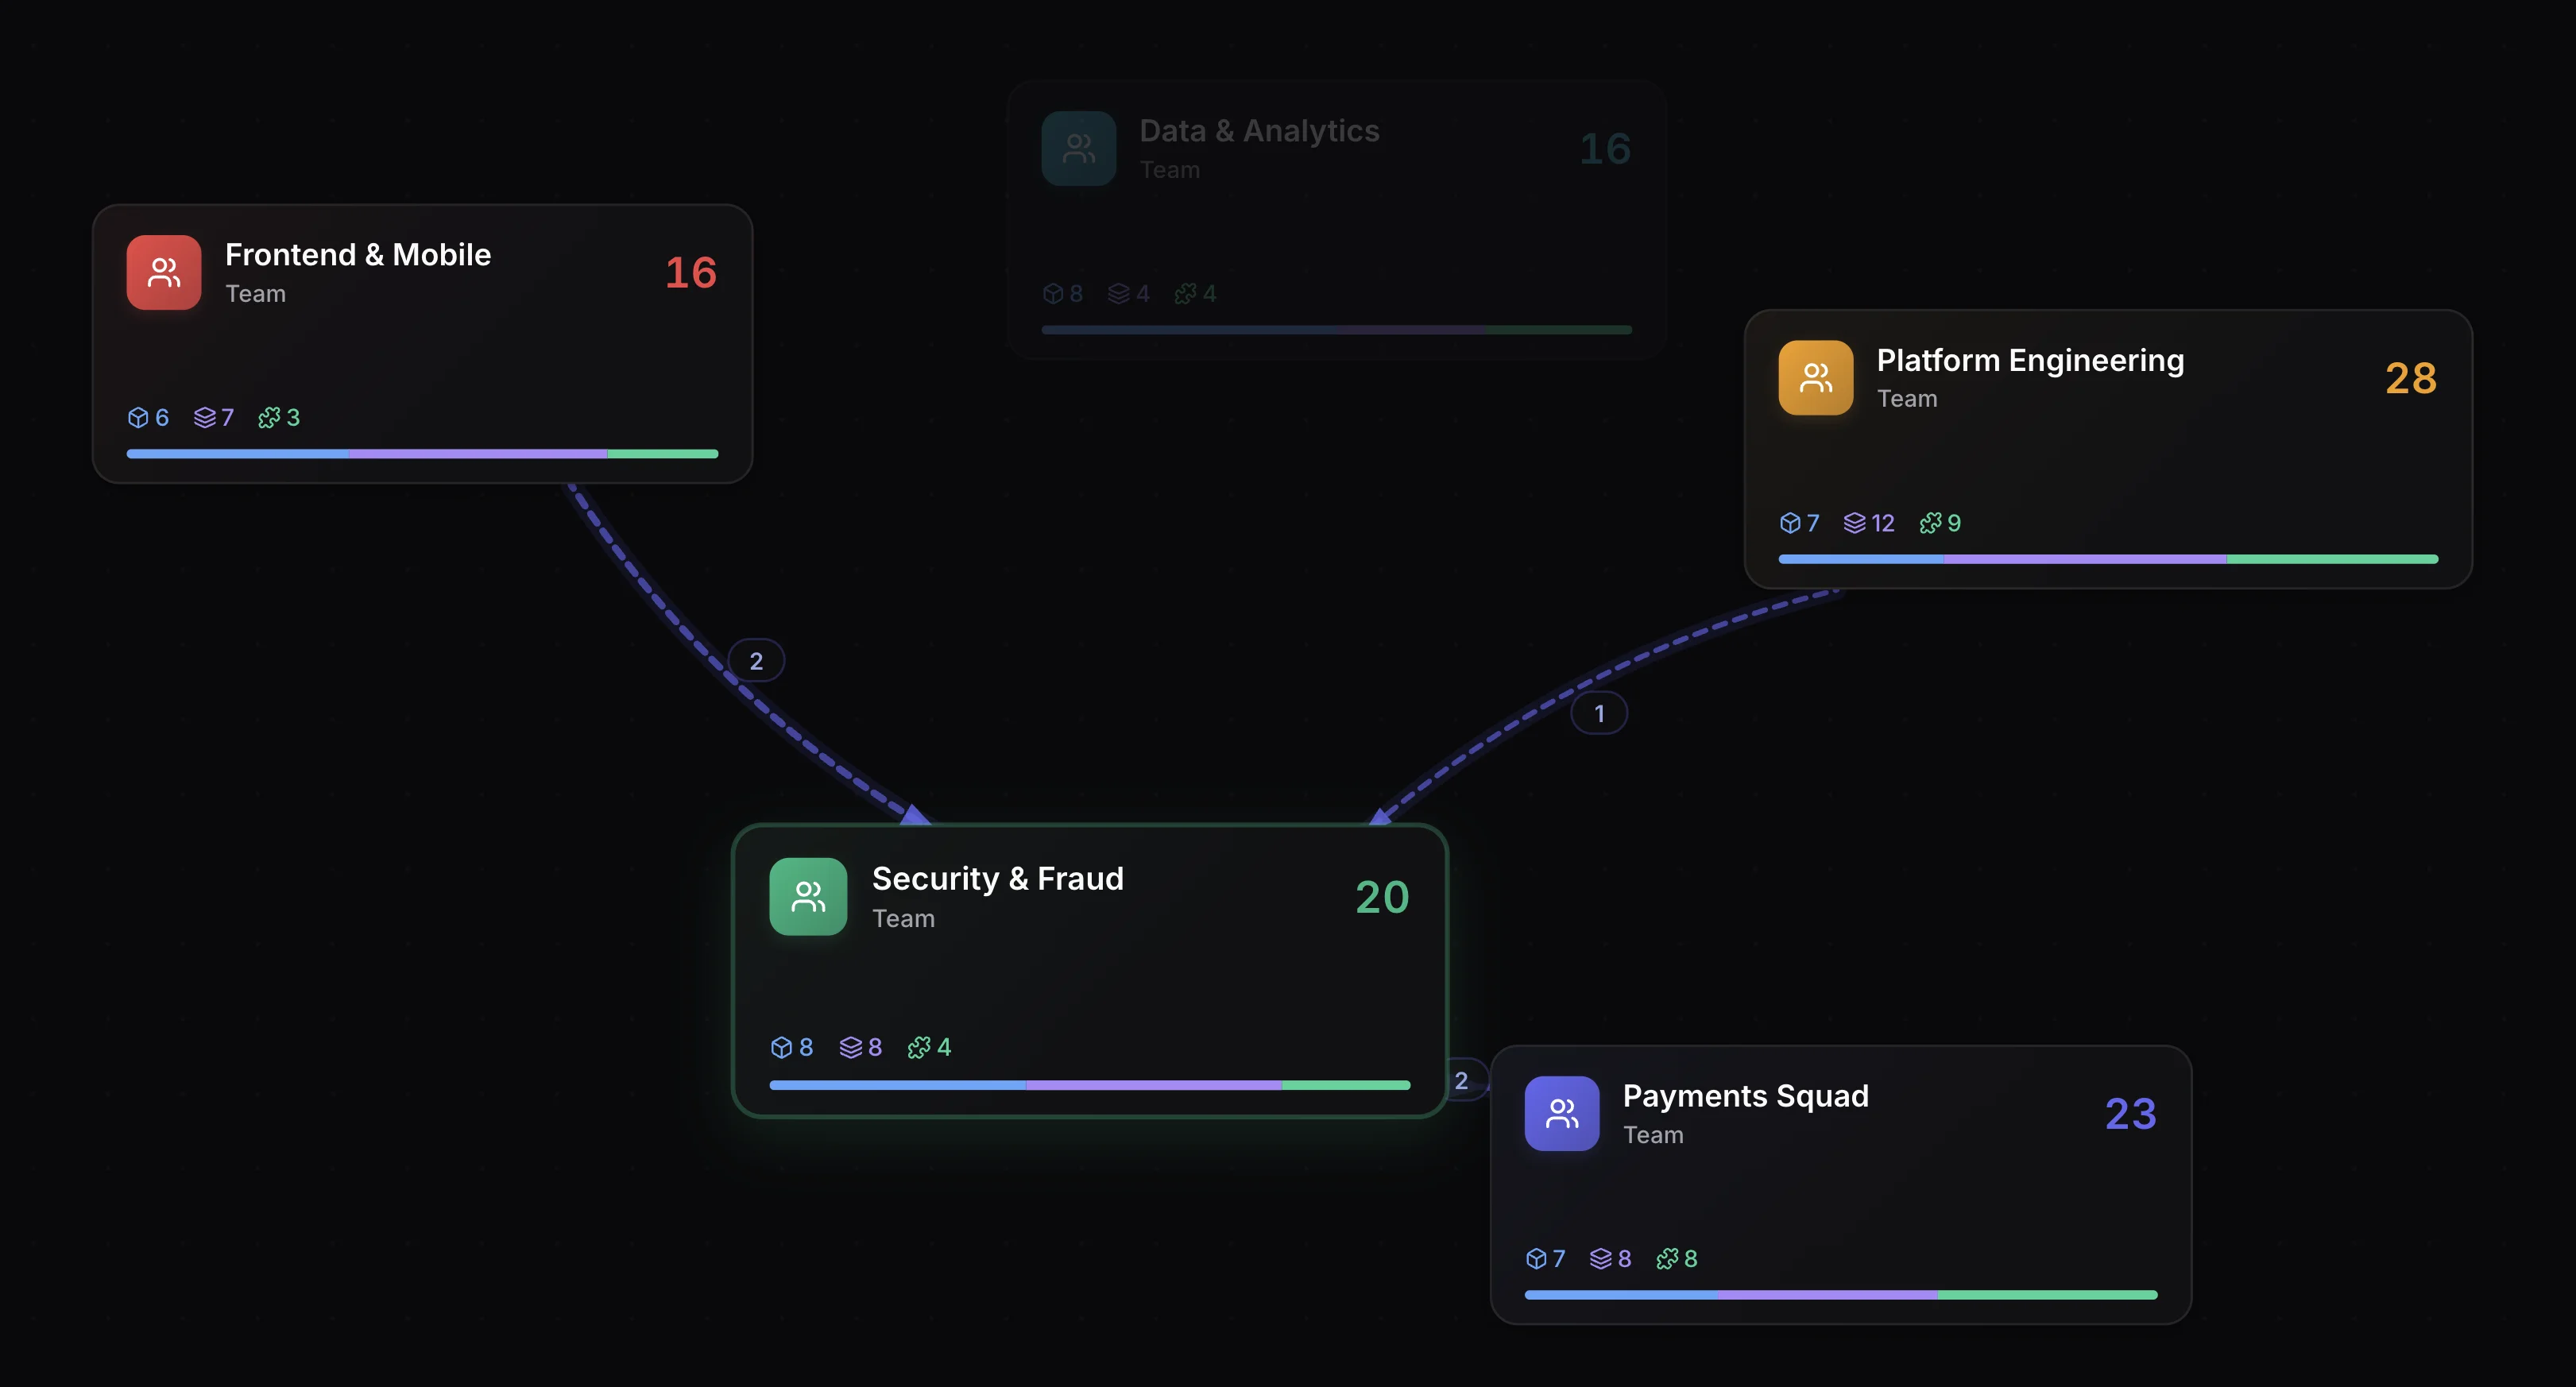
The Ownership Map is a new tab in Archyl's Global Architecture view. It shows every team and user in your organization as interactive bubbles, sized by the number of C4 elements they own. Hover over a bubble to see dependency lines flowing to connected owners. Click one to drill into every system, container, and component that team is responsible for.
It's a live, visual answer to "who owns what" — built from the same C4 model you already maintain.
The Ownership Problem Is an Architecture Problem
Most teams track ownership in spreadsheets, wiki pages, or Slack channel descriptions. These references go stale within weeks. A service gets handed off, a team gets reorganized, an intern's side project becomes production infrastructure — and the ownership doc doesn't update because nobody remembers it exists.
This matters because ownership isn't just administrative bookkeeping. It's an architectural signal. When you can see that one team owns 40 services and another owns 3, that's a capacity problem. When you see that two teams' services are deeply interconnected but they never talk to each other, that's a coupling problem. When 30% of your architecture has no owner at all, that's a risk problem.
The Ownership Map makes these signals visible by design.
How It Works
Assigning Ownership
Every C4 element — system, container, or component — can be assigned to one or more teams or users. You can set ownership from the element's detail panel on any project diagram, or let it flow from your AI-powered discovery process.
Elements can have both team owners and individual user owners simultaneously. A system might be owned by the "Platform Engineering" team with a specific tech lead assigned as the individual accountable person.
The Bubble View
The overview displays all owners as colored circles packed in a force-directed layout. The layout is smart about positioning: teams with dependency relationships are placed closer together, creating a natural clustering that reflects your actual organization topology.
Each bubble shows:
- The team or user name
- An icon or avatar (if one has been uploaded)
- The total number of owned elements
- A breakdown by C4 level (systems, containers, components)
Dependency Lines
This is where it gets interesting. When C4 relationships exist between elements owned by different teams, the Ownership Map draws dependency lines between those owners. Hover over any bubble and its dependency lines animate in, showing which other teams it's coupled to and how many relationships connect them.
This reveals cross-team dependencies that are invisible in a traditional org chart. If your Frontend team's BFF layer depends on 15 different endpoints owned by 4 different backend teams, you'll see that coupling immediately. If two teams have zero dependencies between them despite sitting in the same domain, that's worth investigating too.
Drill-Down Detail
Click any bubble to zoom in with a smooth circular reveal animation. The detail view shows:
- A hero header with the team's icon, name, and type
- Stats cards for total elements, systems, containers, and components — each clickable as a filter
- A card grid of every owned element, grouped by C4 level
- Co-ownership pills showing other teams that share responsibility for the same elements
- Element descriptions and project names for full context
Press Escape or click Back to return to the overview.
Coverage Tracking
The page header displays an ownership coverage percentage — the ratio of elements with at least one owner to total elements. Coverage is broken down by C4 level so you can see if your systems are well-owned but your components are neglected.
A toggle reveals unowned elements as a separate gray bubble, making coverage gaps immediately visible.
Search
The search bar works as fulltext across everything: owner names, element names, and project names. Type "payments" and you'll see every team that owns something payment-related, regardless of whether the team itself has "payments" in its name.
What This Changes
Before: Ownership Is Tribal Knowledge
- "I think the Payments team owns that, but check with Sarah"
- The wiki page hasn't been updated since Q2
- New engineers spend days figuring out who to ask
- Incident response starts with 10 minutes of "whose service is this?"
After: Ownership Is Visible and Accountable
- Every element has a clear owner (or a visible gap)
- Cross-team dependencies are surfaced automatically
- New engineers see the full ownership landscape on day one
- Coverage percentage creates a measurable hygiene goal
Built Into Your Workflow
The Ownership Map isn't a standalone tool — it's woven into the rest of Archyl:
AI Chat — Ask questions like "who owns the API Gateway?" or "which team has the most unowned components?" The architecture chat now includes ownership data in its context, so it can answer accountability questions directly.
MCP Server — The Archyl MCP server exposes a get_ownership_map tool, so your AI coding assistants (Claude Code, Cursor, etc.) can query ownership data while you work. Ask "who should I talk to about this service?" and get an answer without leaving your editor.
DORA Metrics — Combine ownership with DORA metrics to understand which teams are shipping fastest, which have the highest failure rates, and where recovery times are longest. Ownership + delivery performance = actionable team health data.
Release Management — See which teams' services are being deployed most frequently, and which have releases stuck in staging. Ownership context makes release tracking more meaningful.
Getting Started
If you're already using Archyl, the Ownership Map is available now in the Global Architecture view.
- Navigate to Global Architecture → Ownership tab
- Assign owners to your C4 elements via the diagram detail panels
- Watch the bubbles appear and dependency lines form
- Set a coverage goal and track progress over time
If you're running the demo, ownership data is pre-populated with five domain teams (Platform Engineering, Payments Squad, Security & Fraud, Frontend & Mobile, Data & Analytics) so you can explore the full experience immediately.
The Ownership Map is available on all plans, including the free tier.
Read more: