C4 Model Examples: Stripe, Netflix, Uber and Revolut
Most C4 model examples you find are a single toy system: a bank, a webshop, an internet banking app with three boxes and a database. They show the notation. They don't show the hard part, which is deciding what to leave out when the real system has hundreds of services.
This page collects four larger C4 model examples, each modeled from context down to components: a Stripe card charge, a Netflix play request, an Uber ride request and a Revolut cross-border transfer. Each one comes with its level 1 diagram, a short summary of how it zooms to levels 2 and 3, and a link to the full write-up. At the end there's a small example you can copy, and a list of what the four have in common.
A note on sources. All four examples come from our "Anatomy of" series, and each is based entirely on the company's public communications: engineering blogs, conference talks, open-source repositories, job postings and external case studies. None of them is an official architecture document from the company concerned. Each full post marks where details are inferred rather than stated by the company.
If the C4 model itself is new to you, read what the C4 model is first. The four level guides go deeper on each diagram type: system context, container, component and code.
What makes a good C4 example
A C4 diagram example is useful when you can learn a decision from it, not just a shape. The four below were written to the same rules, and those rules are worth stealing before you look at any of them.
Follow one user action. None of these examples tries to document the whole company. Each one picks a single thing a user does (a charge, a play, a ride, a transfer) and only draws what that action touches. That's what keeps a thousand-service estate down to a readable page.
Keep level 1 to about ten boxes. At the System Context level, a company like Netflix is not a thousand microservices. It's a handful of product systems and the external actors around them. If your level 1 diagram needs forty boxes, the boundaries are drawn at the wrong height.
Zoom into one path at level 2. The container diagram shows the containers on the path of that one action, with technologies and protocols. It doesn't show every container the company runs.
Pick the level 3 zoom for a reason. Only one container gets a component diagram, and it's the one where the interesting engineering lives, or the one the company has documented publicly in enough depth to model honestly.
Explain the boxes with decisions. Each example carries three short architecture decision records between levels. A diagram shows what exists. The ADR says why it looks that way, which is the question a new hire asks first.
Here's how the four compare at a glance:
| Example | Action traced | Level 1 | Level 2 zoom | Level 3 zoom |
|---|---|---|---|---|
| Stripe | A card charge (PaymentIntents.create()) |
15 product systems | Payments core | Idempotency layer |
| Netflix | Pressing Play | 10 systems | Streaming Platform | Cosmos video pipeline |
| Uber | A ride request, tap to driver accepted | 3 product platforms, 1 Marketplace, Foundation platforms | Marketplace dispatch path | DISCO matching engine |
| Revolut | A EUR to GBP transfer | 8 product systems | The transfer path in Retail Banking | Sherlock fraud engine |
Example 1: Stripe, a card charge
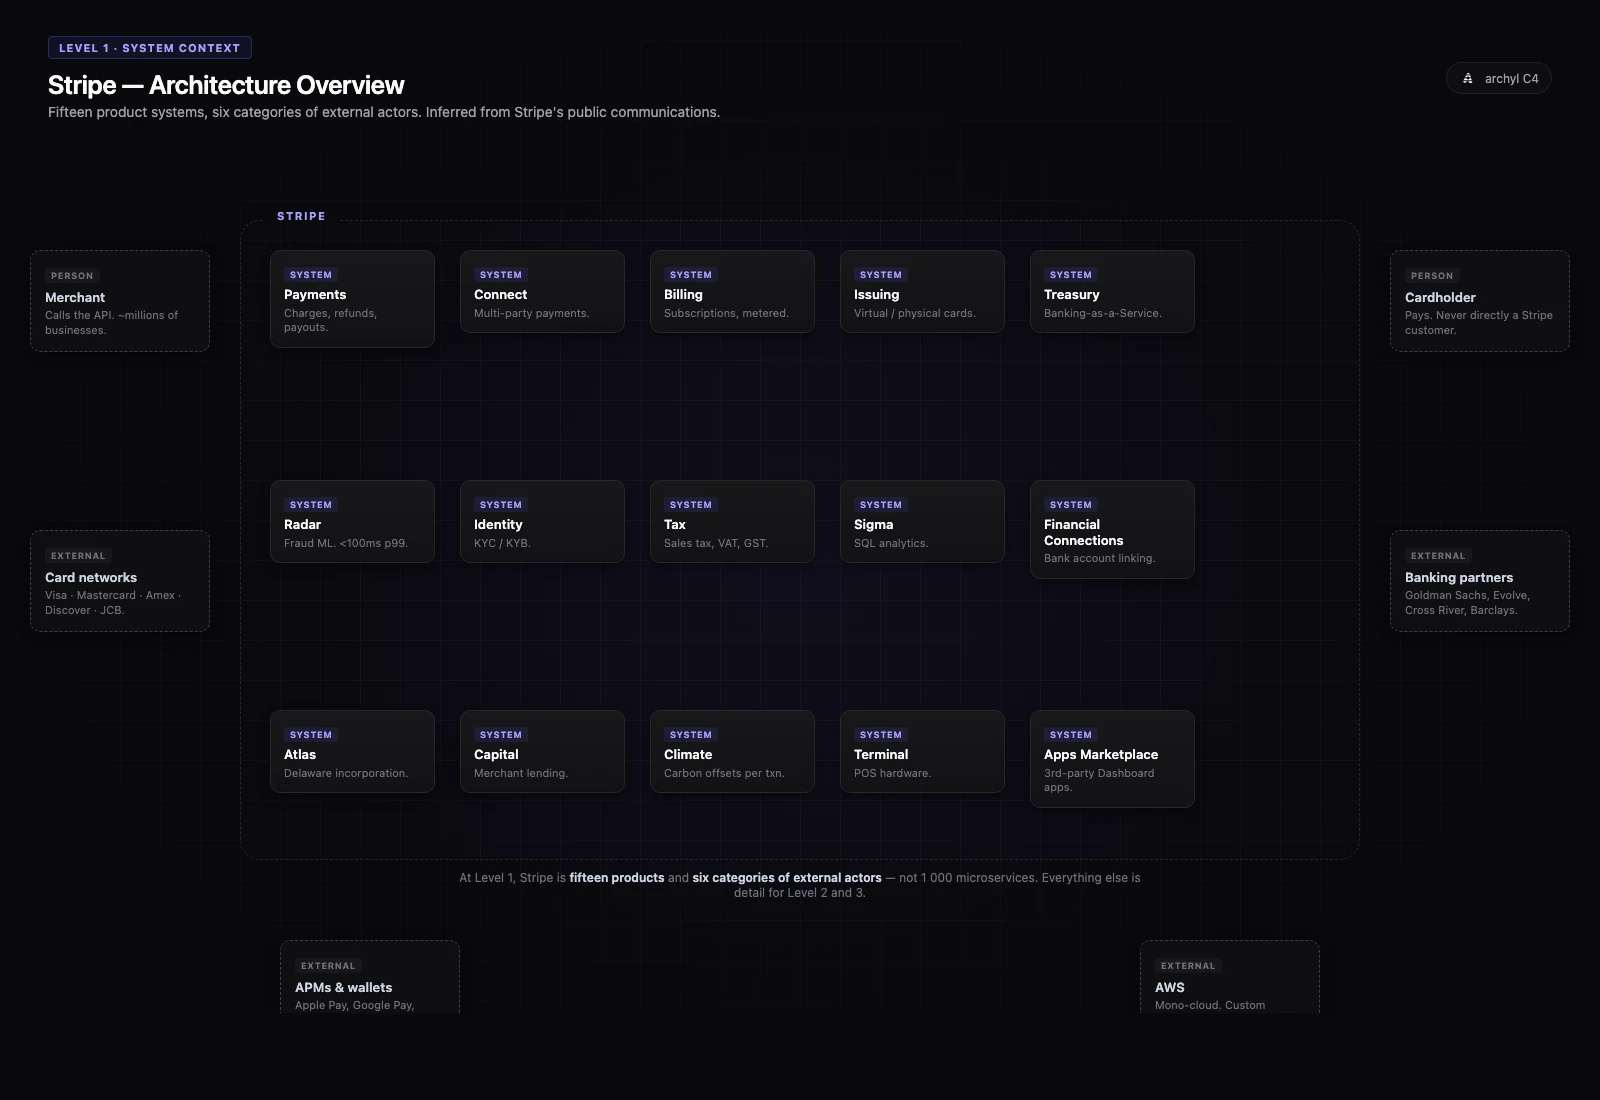
Based on Stripe's public communications. Not an official Stripe architecture document.
Level 1. At System Context, Stripe is not "a payments API". Our model shows fifteen product systems sharing one foundation: Payments, Connect, Billing, Radar, Issuing, Treasury and the rest. Around them sit merchants, cardholders, the card networks, alternative payment methods, acquiring and issuing banks, banking partners and AWS.
Level 2. The container diagram opens the Payments box and follows one PaymentIntents.create() call: the API gateway, an idempotency layer in front of every mutating endpoint, the PaymentIntent state machine, a card data vault, Radar scoring in parallel, the network connectors, the ledger and webhook delivery.
Level 3. The component zoom goes inside the idempotency layer, because it's the most publicly documented part of the stack: a request hasher, a key store in PostgreSQL, a phase executor and a recovery-point tracker that lets a retried request resume where it stopped.
What to take from it. This is the example to study for component diagrams. The level 3 view isn't a list of classes; it's a chain of steps a reader can reason about ("every external side effect sits between two recovery points").
Full post: Anatomy of a Charge: Modeling Stripe in C4.
Example 2: Netflix, a play request
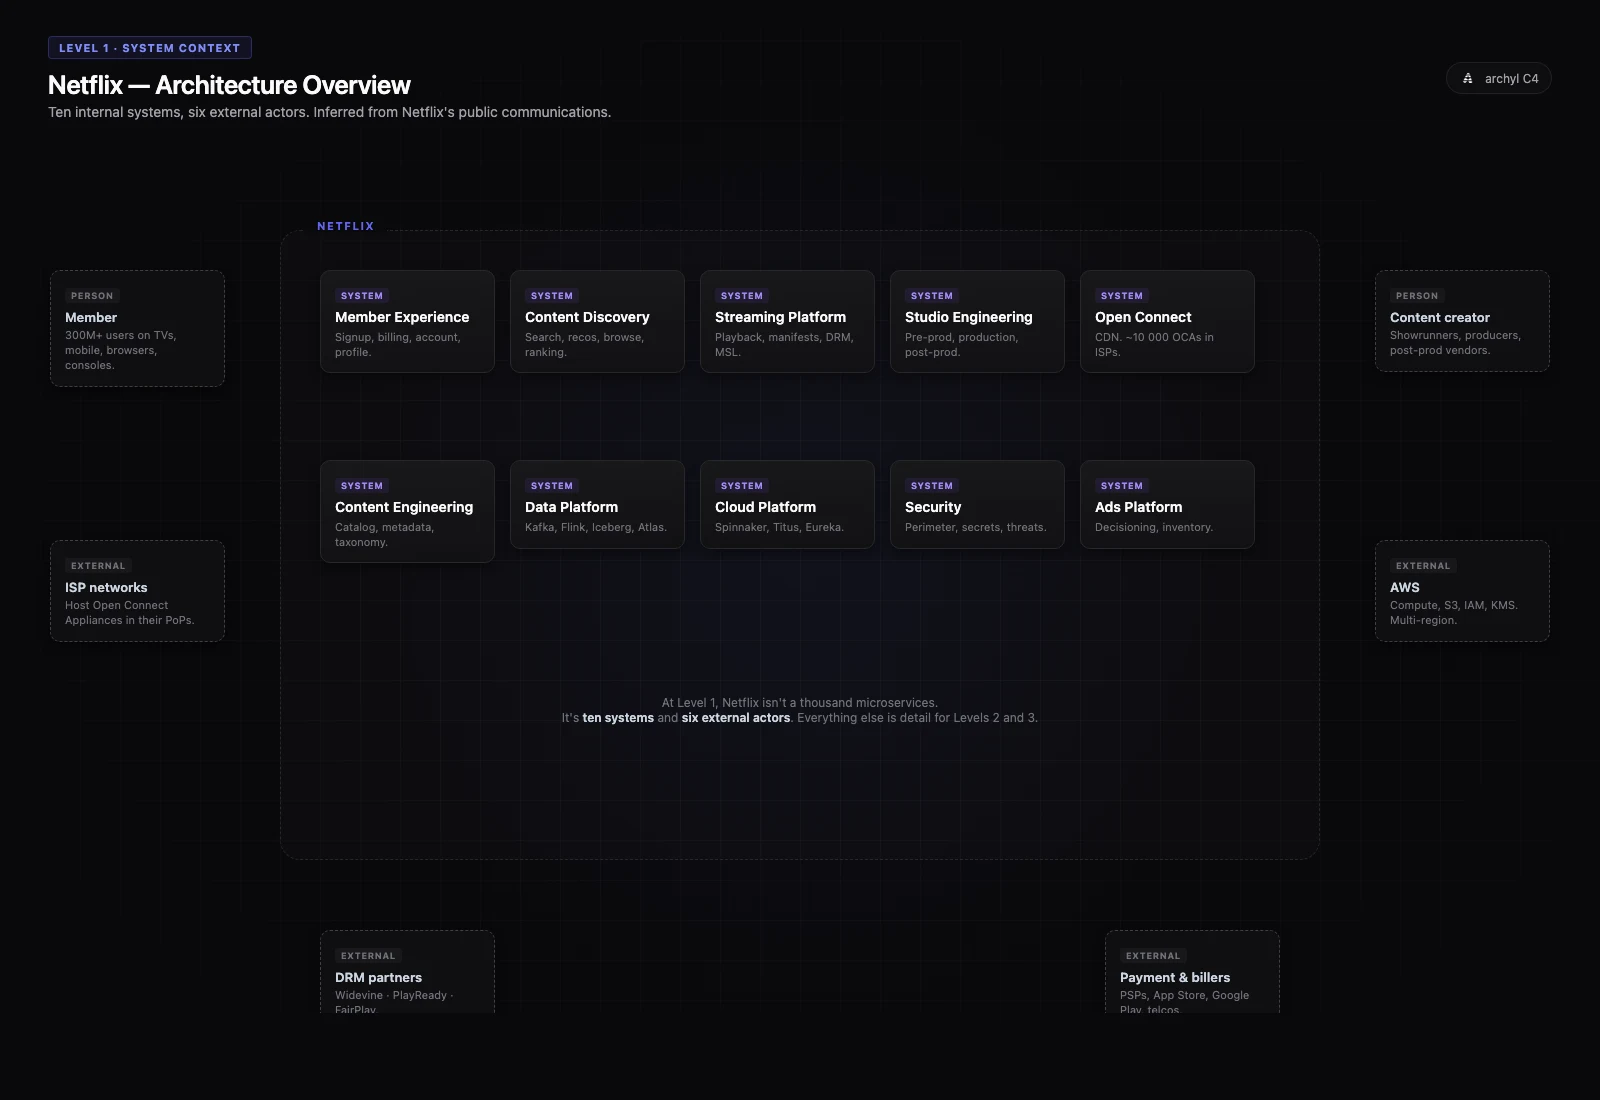
Based on Netflix's public communications. Not an official Netflix architecture document.
Level 1. Ten systems emerge consistently from Netflix's public material: Member Experience, Content Discovery, Streaming Platform, Open Connect, Studio Engineering, Content Engineering, Data Platform, Cloud Platform, Security and the Ads Platform. External actors include member devices, ISPs that host Open Connect appliances, AWS, DRM providers, payment partners and content studios.
Level 2. The container zoom opens the Streaming Platform and follows a play request: the Playback API, the manifest service, the license service for DRM, the message security layer, an EVCache tier and the Cassandra clusters behind it. The manifest points the device at an Open Connect appliance, which is where the level 1 decision to build a CDN shows up again.
Level 3. The component view goes into Cosmos, the video encoding pipeline. It isn't on the play path at request time (encoding happens when a title is ingested), and the post says so. It was chosen because Netflix has published enough about it to name each step: inspection, complexity analysis, ladder generation, encoding, validation and quality scoring.
What to take from it. The clearest demonstration of "ten things, not a thousand" at level 1, and a good example of admitting when the level 3 zoom leaves the traced path.
Full post: Anatomy of a Play: Modeling Netflix in C4.
Example 3: Uber, a ride request
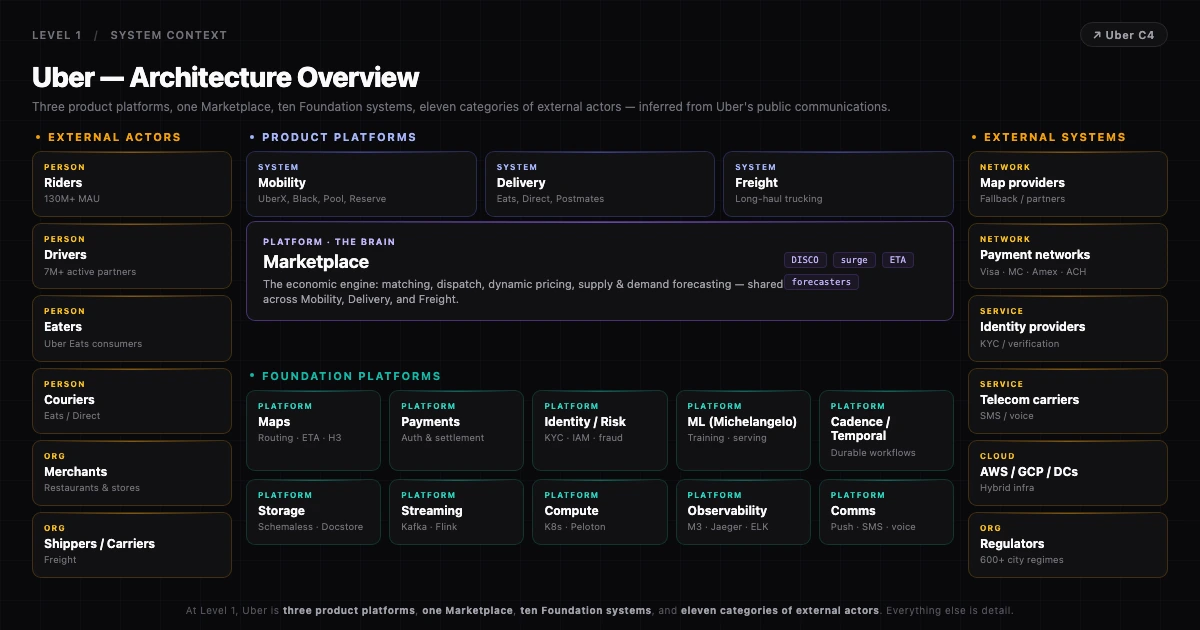
Based on Uber's public communications. Not an official Uber architecture document.
Level 1. Uber at System Context is three product platforms (Mobility, Delivery, Freight) sitting on one shared Marketplace, with a layer of Foundation platforms underneath: Maps, Payments, identity and risk, communications, the ML platform, the workflow engine, storage, streaming, observability and compute. External actors include riders, drivers, eaters, couriers, merchants, payment networks, telecom carriers and city regulators.
Level 2. The container zoom follows a ride request through Marketplace's dispatch path: the edge gateway, a trip orchestrator that runs each trip as a workflow instance, the matching engine, dynamic pricing, the ETA service, driver state, the storage layer and Kafka.
Level 3. The component view opens the matching engine: a request normalizer that turns coordinates into H3 hexagon indexes, a supply scanner, a ring expander, a candidate ranker, an assignment solver, the notification dispatcher and a fallback path.
What to take from it. The example of how to draw a platform company at level 1 without drawing every product. The shared Marketplace in the middle tells you more about Uber's architecture than any list of services would.
Full post: Anatomy of a Ride: Modeling Uber in C4.
Example 4: Revolut, a cross-border transfer
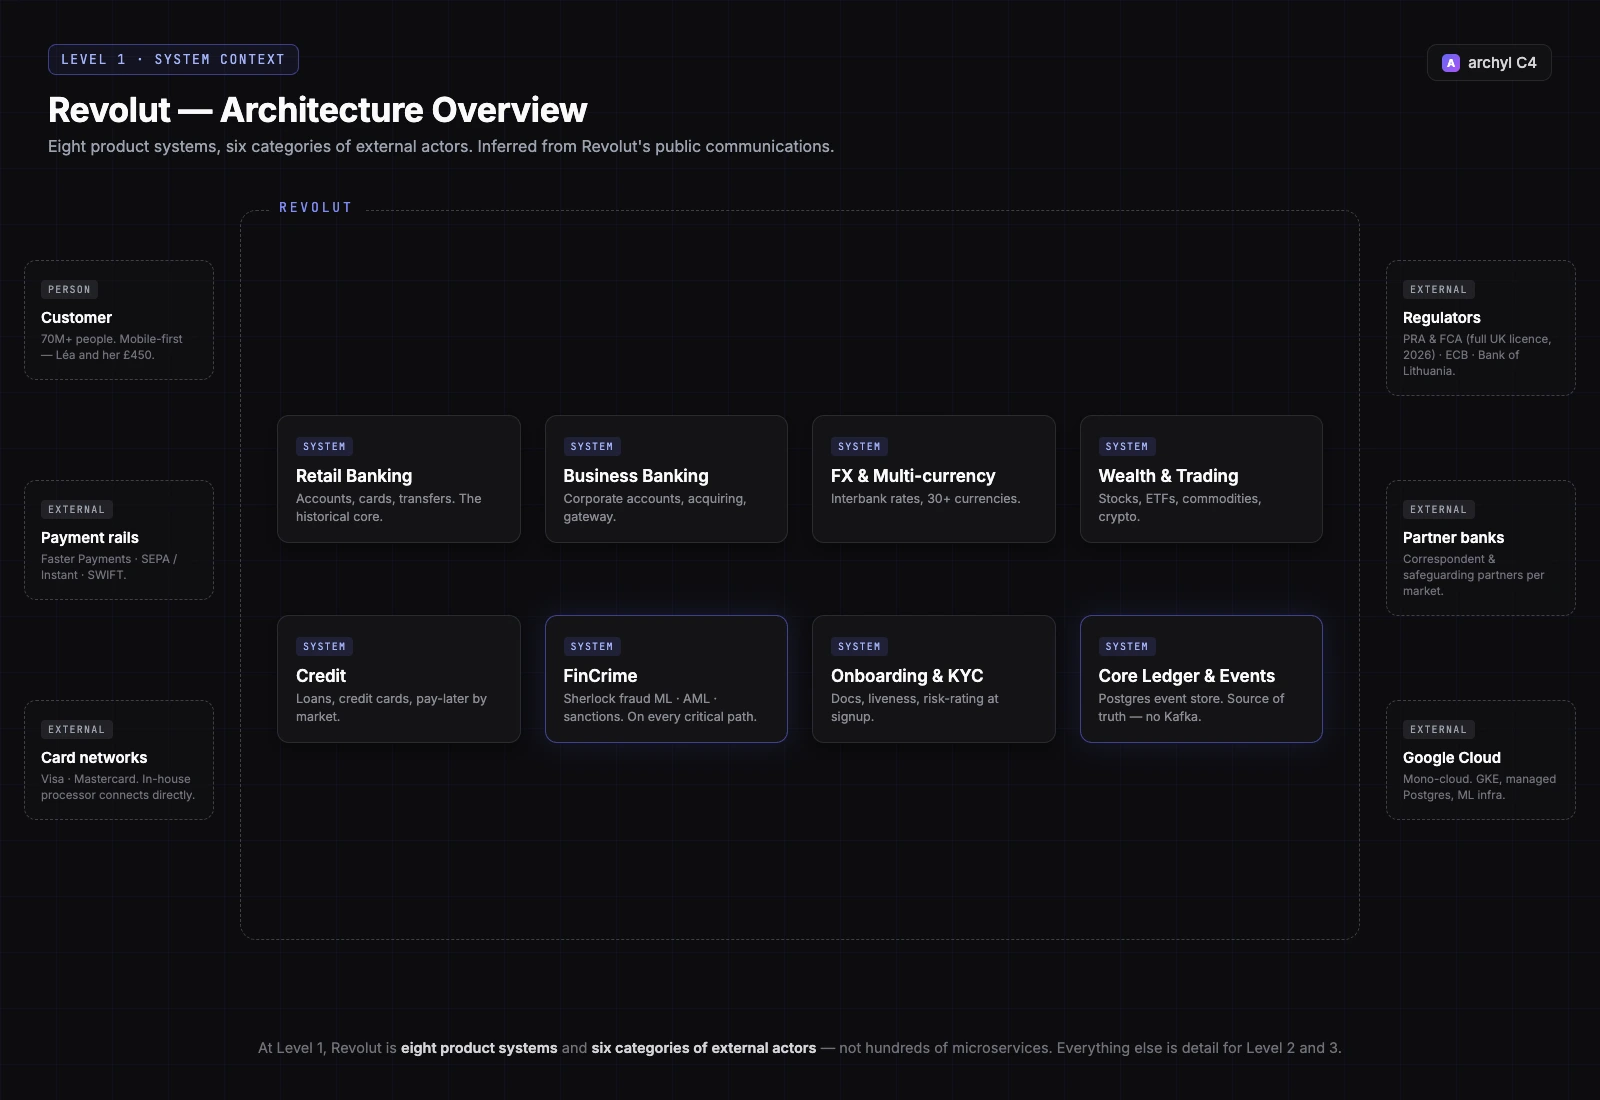
Based on Revolut's public communications. Not an official Revolut architecture document.
Level 1. Public communications describe at least eight product systems: Retail Banking, Business Banking, FX, Wealth and Trading, Credit, FinCrime, Onboarding and KYC, and the core ledger with its event backbone. Around them: card networks, payment rails (Faster Payments, SEPA, SWIFT), partner banks, regulators and Google Cloud. The diagram makes one thing obvious that an org chart wouldn't: FinCrime has arrows from every product, so it sits on the critical path of all of them.
Level 2. The container zoom follows a EUR to GBP transfer through Retail Banking: the mobile apps, the API edge, a transfer orchestrator with an explicit state machine, a double-entry ledger on PostgreSQL, the FX engine, the FinCrime pipeline, one connector per payment rail, the event store and notifications.
Level 3. The component view opens Sherlock, the fraud engine: feature assembly, an in-memory profile store, the model server, a decision policy, nightly retraining and an analyst feedback loop.
What to take from it. This is the most complete example of the four. It adds a step-by-step timeline between levels 1 and 2 (with latencies clearly labeled as illustrative, not published), and a "steal this, skip this" section that says which decisions a ten-service team should copy and which it shouldn't.
Full post: Anatomy of a Transfer: Modeling Revolut in C4.
A small example you can copy
The four examples above are big on purpose. Most systems aren't, so here's a small C4 model example at all three useful levels: the e-commerce platform used throughout our complete guide to the C4 model. Copy the shape, rename the boxes.
Level 1: System Context
[Customer] --> [E-Commerce Platform] : Browses products, places orders
[Warehouse Staff] --> [E-Commerce Platform] : Manages inventory
[E-Commerce Platform] --> [Payment Gateway (Stripe)] : Processes payments
[E-Commerce Platform] --> [Shipping Provider (FedEx API)] : Creates shipments
[E-Commerce Platform] --> [Email Service (SendGrid)] : Sends notifications
Two kinds of user, three external systems, one box for everything you own.
Level 2: Container
[Single-Page Application (React)] --> [API Gateway (Kong)] : Makes API calls (HTTPS/JSON)
[API Gateway] --> [Order Service (Go)] : Routes requests
[API Gateway] --> [Product Service (Go)] : Routes requests
[API Gateway] --> [User Service (Go)] : Routes requests
[Order Service] --> [Order Database (PostgreSQL)] : Reads/writes orders
[Product Service] --> [Product Database (PostgreSQL)] : Reads/writes products
[User Service] --> [User Database (PostgreSQL)] : Reads/writes users
[Order Service] --> [Message Queue (Kafka)] : Publishes order events
[Notification Service (Go)] --> [Message Queue] : Consumes order events
Every box names its technology, every arrow names its protocol or purpose, and the data stores are drawn as containers.
Level 3: Component (inside the Order Service)
[Order Handler] --> [Order Service] : Delegates business logic
[Order Service] --> [Order Repository] : Persists orders
[Order Service] --> [Payment Client] : Validates payment
[Order Service] --> [Inventory Client] : Checks stock availability
[Order Repository] --> [Order Database (PostgreSQL)] : SQL queries
[Payment Client] --> [Payment Gateway (Stripe)] : HTTPS/REST
[Inventory Client] --> [Product Service] : gRPC
Only one container gets a component diagram, the same rule the four big examples follow. The Product and User services are simple CRUD, so drawing their insides would add nothing a folder listing doesn't already show.
For the reasoning behind each of these choices, see the level guides: what belongs on a system context diagram, what belongs on a container diagram and when a component diagram is worth drawing. We skipped level 4 here for the same reason most teams do; the code diagram guide explains when it earns its place.
What the four have in common
Set side by side, the four examples follow the same handful of habits. None of them is a rule from the C4 model itself. They're what made these models readable.
Roughly ten boxes at level 1. Fifteen for Stripe, ten for Netflix, eight for Revolut, and for Uber three product platforms on one Marketplace with the Foundation platforms underneath. None of these companies is small. The level 1 diagrams stay small because they group by product system, not by service.
One path at level 2. Each container diagram shows only the containers one action passes through. Stripe's container view has no Billing or Atlas containers. Netflix's has nothing from Studio Engineering. That's not an omission; those containers belong on a different diagram for a different action.
One container at level 3, chosen honestly. The component zoom always goes where public documentation is deep enough to draw real components. Netflix's post says outright that Cosmos is off the play path at request time. An example that hides that kind of choice teaches the wrong lesson.
External systems carry as much weight as internal ones. Card networks, ISPs, payment rails, telecom carriers: in all four, some of the most important boxes are things the company doesn't own. Revolut's rail connectors are the containers whose failure it can't engineer away, and the diagram is what makes that visible.
Decisions sit next to the boxes. Each example has three ADRs, and each ADR explains a box a newcomer would find surprising: why Netflix has Open Connect where other streaming services have a commercial CDN, why Revolut has no Kafka, why Stripe built on MongoDB rather than migrating off it. If you want the method for writing those, the complete guide to architecture decision records covers it.
Every box has an owner. Each post ends its model with an ownership map: which team owns which system or container. It's the step that turns a diagram into something someone is accountable for keeping true.
Model your own system
You don't need Stripe's volume or Uber's service count for any of this to apply. The same steps work for a system with ten services:
- Pick one user action that matters: the checkout, the signup, the thing that pages someone at 3 am.
- Draw level 1 with your system as one box, every kind of user, and every external system that action touches. Aim for fewer than fifteen boxes.
- Draw level 2 for that one action. Only the containers it passes through, each labeled with its technology, each arrow labeled with a verb and a protocol.
- Choose one container for level 3, the one a new hire would struggle with, and draw its main components.
- Write three ADRs for the three boxes someone will ask "why is it like that?" about.
- Put a team name on every container.
Then repeat for the next action. After three or four actions the level 2 diagrams start to overlap, and the overlap is your real container diagram.
The part the four examples can't show is what happens six months later, when the code has moved and the diagrams haven't. That's the problem archyl is built around. Connect a repository and AI discovery proposes systems, containers, components and relationships for you to approve instead of drawing them from scratch, and a drift score checks the model against the code afterwards so you find out when it has gone stale.
FAQ
What is a good example of a C4 model?
A good C4 model example traces one real user action across levels 1 to 3 and explains its surprising boxes. The four examples on this page (Stripe, Netflix, Uber, Revolut) each do that, with a level 1 diagram of roughly ten systems, a container diagram limited to one path, and one component zoom. For a small system, the e-commerce example above is a sensible template.
Where can I find a C4 container diagram example?
Each of the four full posts has a level 2 container diagram: Stripe's Payments core, Netflix's Streaming Platform, Uber's dispatch path and Revolut's transfer path. For a smaller worked example with a table of containers and relationships, see the C4 container diagram guide.
Are these official architecture diagrams from Stripe, Netflix, Uber and Revolut?
No. Each model is based entirely on the company's public communications, and each full post marks where details are inferred rather than stated. They're meant to show how the C4 model makes a complex stack readable, not to document how these companies run today.
Do C4 examples need all four levels?
Rarely. All four examples here draw levels 1, 2 and 3 and stop. Code-level diagrams change with every refactor and are usually better generated from the code than drawn, which is why most real C4 models stop at components.
How many elements should a C4 system context diagram have?
There's no official limit. In these examples, level 1 ranges from eight to fifteen systems plus their external actors, for companies with hundreds or thousands of services. If yours needs far more, you're probably drawing containers at the wrong level, or you need a system landscape view across several systems.
Want to model your own system in C4? Try archyl free on the Developer plan, no credit card. Keep reading: What is the C4 Model? A Complete Guide | C4 System Context Diagram Guide | C4 Container Diagram Guide | C4 Component Diagram Guide | C4 Code Diagram Guide.